Overview
We recently have been upgrading our java stacks to have the latest new relic agent 6 and 7 to incorporate distributed tracing into our environments. In testing the various versions of the new relic agent six we found that our stacks all took a performance hit. We increased our memory usage and increased our latency thus bringing us in danger of meeting our SLAs.
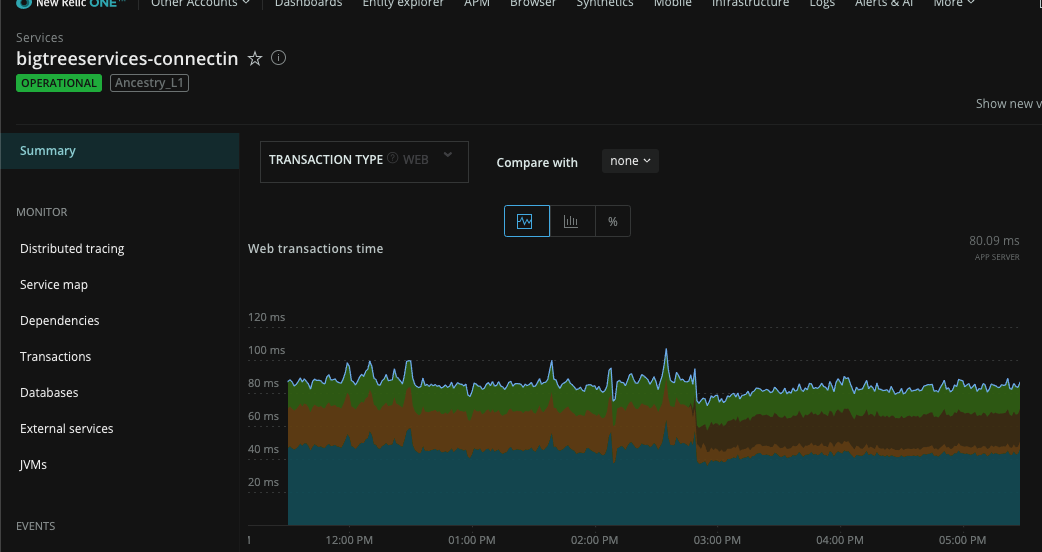
In this stack we did a roll back to a version 5 of the new relic java agent. The graph displays differently for the mysql database connection measurements. On the left is version 6.1 on on the right is version 5.3. There is a clear drop in memory usage when we use the older version of the java agent.
Version 7 Analysis
Right now we are currently testing various versions of the 7 release of new relic java agent. We are seeing an increased memory footprint still and many of our stacks are experiencing java garbage collection problems. This causes our stacks to periodically lock up and slow down response times thus triggering alerts. The issues will clean themselves up usually over a period of 30 minutes, however this creates way too many false alarms in our alerting process. Reaching out to the new relic support isn’t very helpful either. Just be cautious in any upgrades you do with the new relic agent after major version 5.
